In 2019, I got curious and asked Société de Transport de Montréal, Montreal's transit agency, for the foot traffic data of Montreal's subway.
Since then, two years has passed and with COVID-19 still going strong, I wanted to see what impact the pandemic had had. And oh boy, what an impact it is.
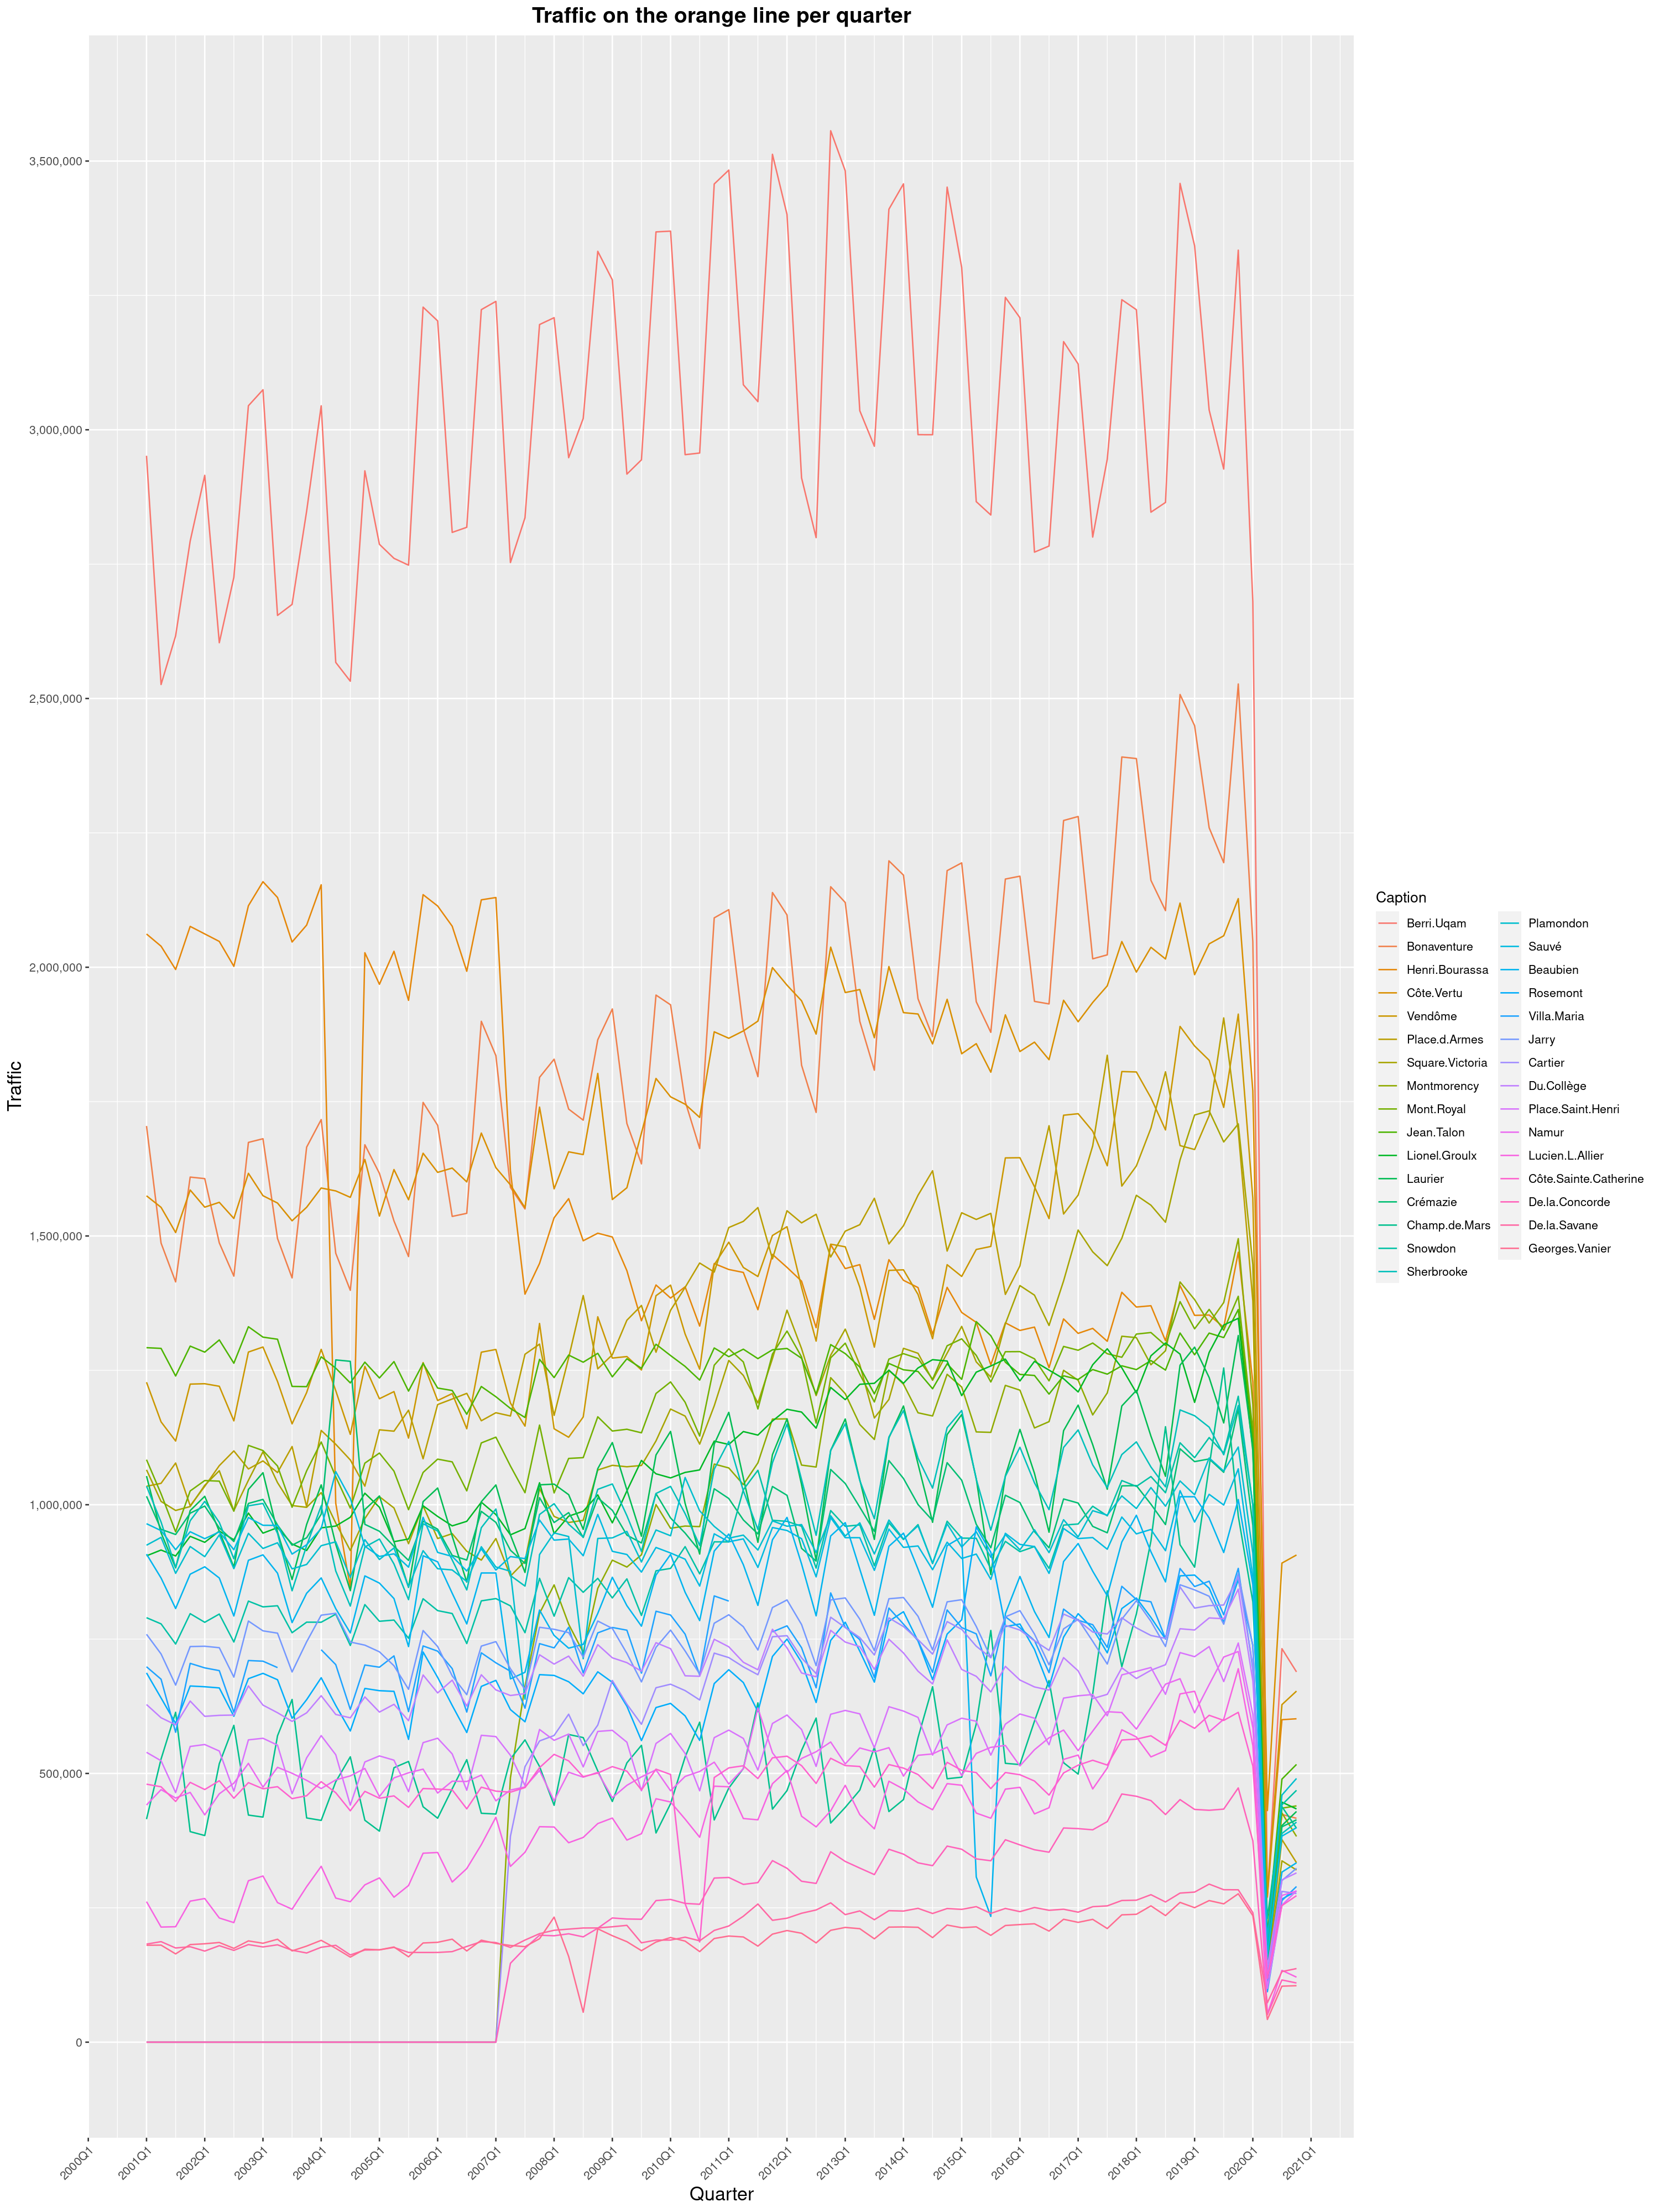
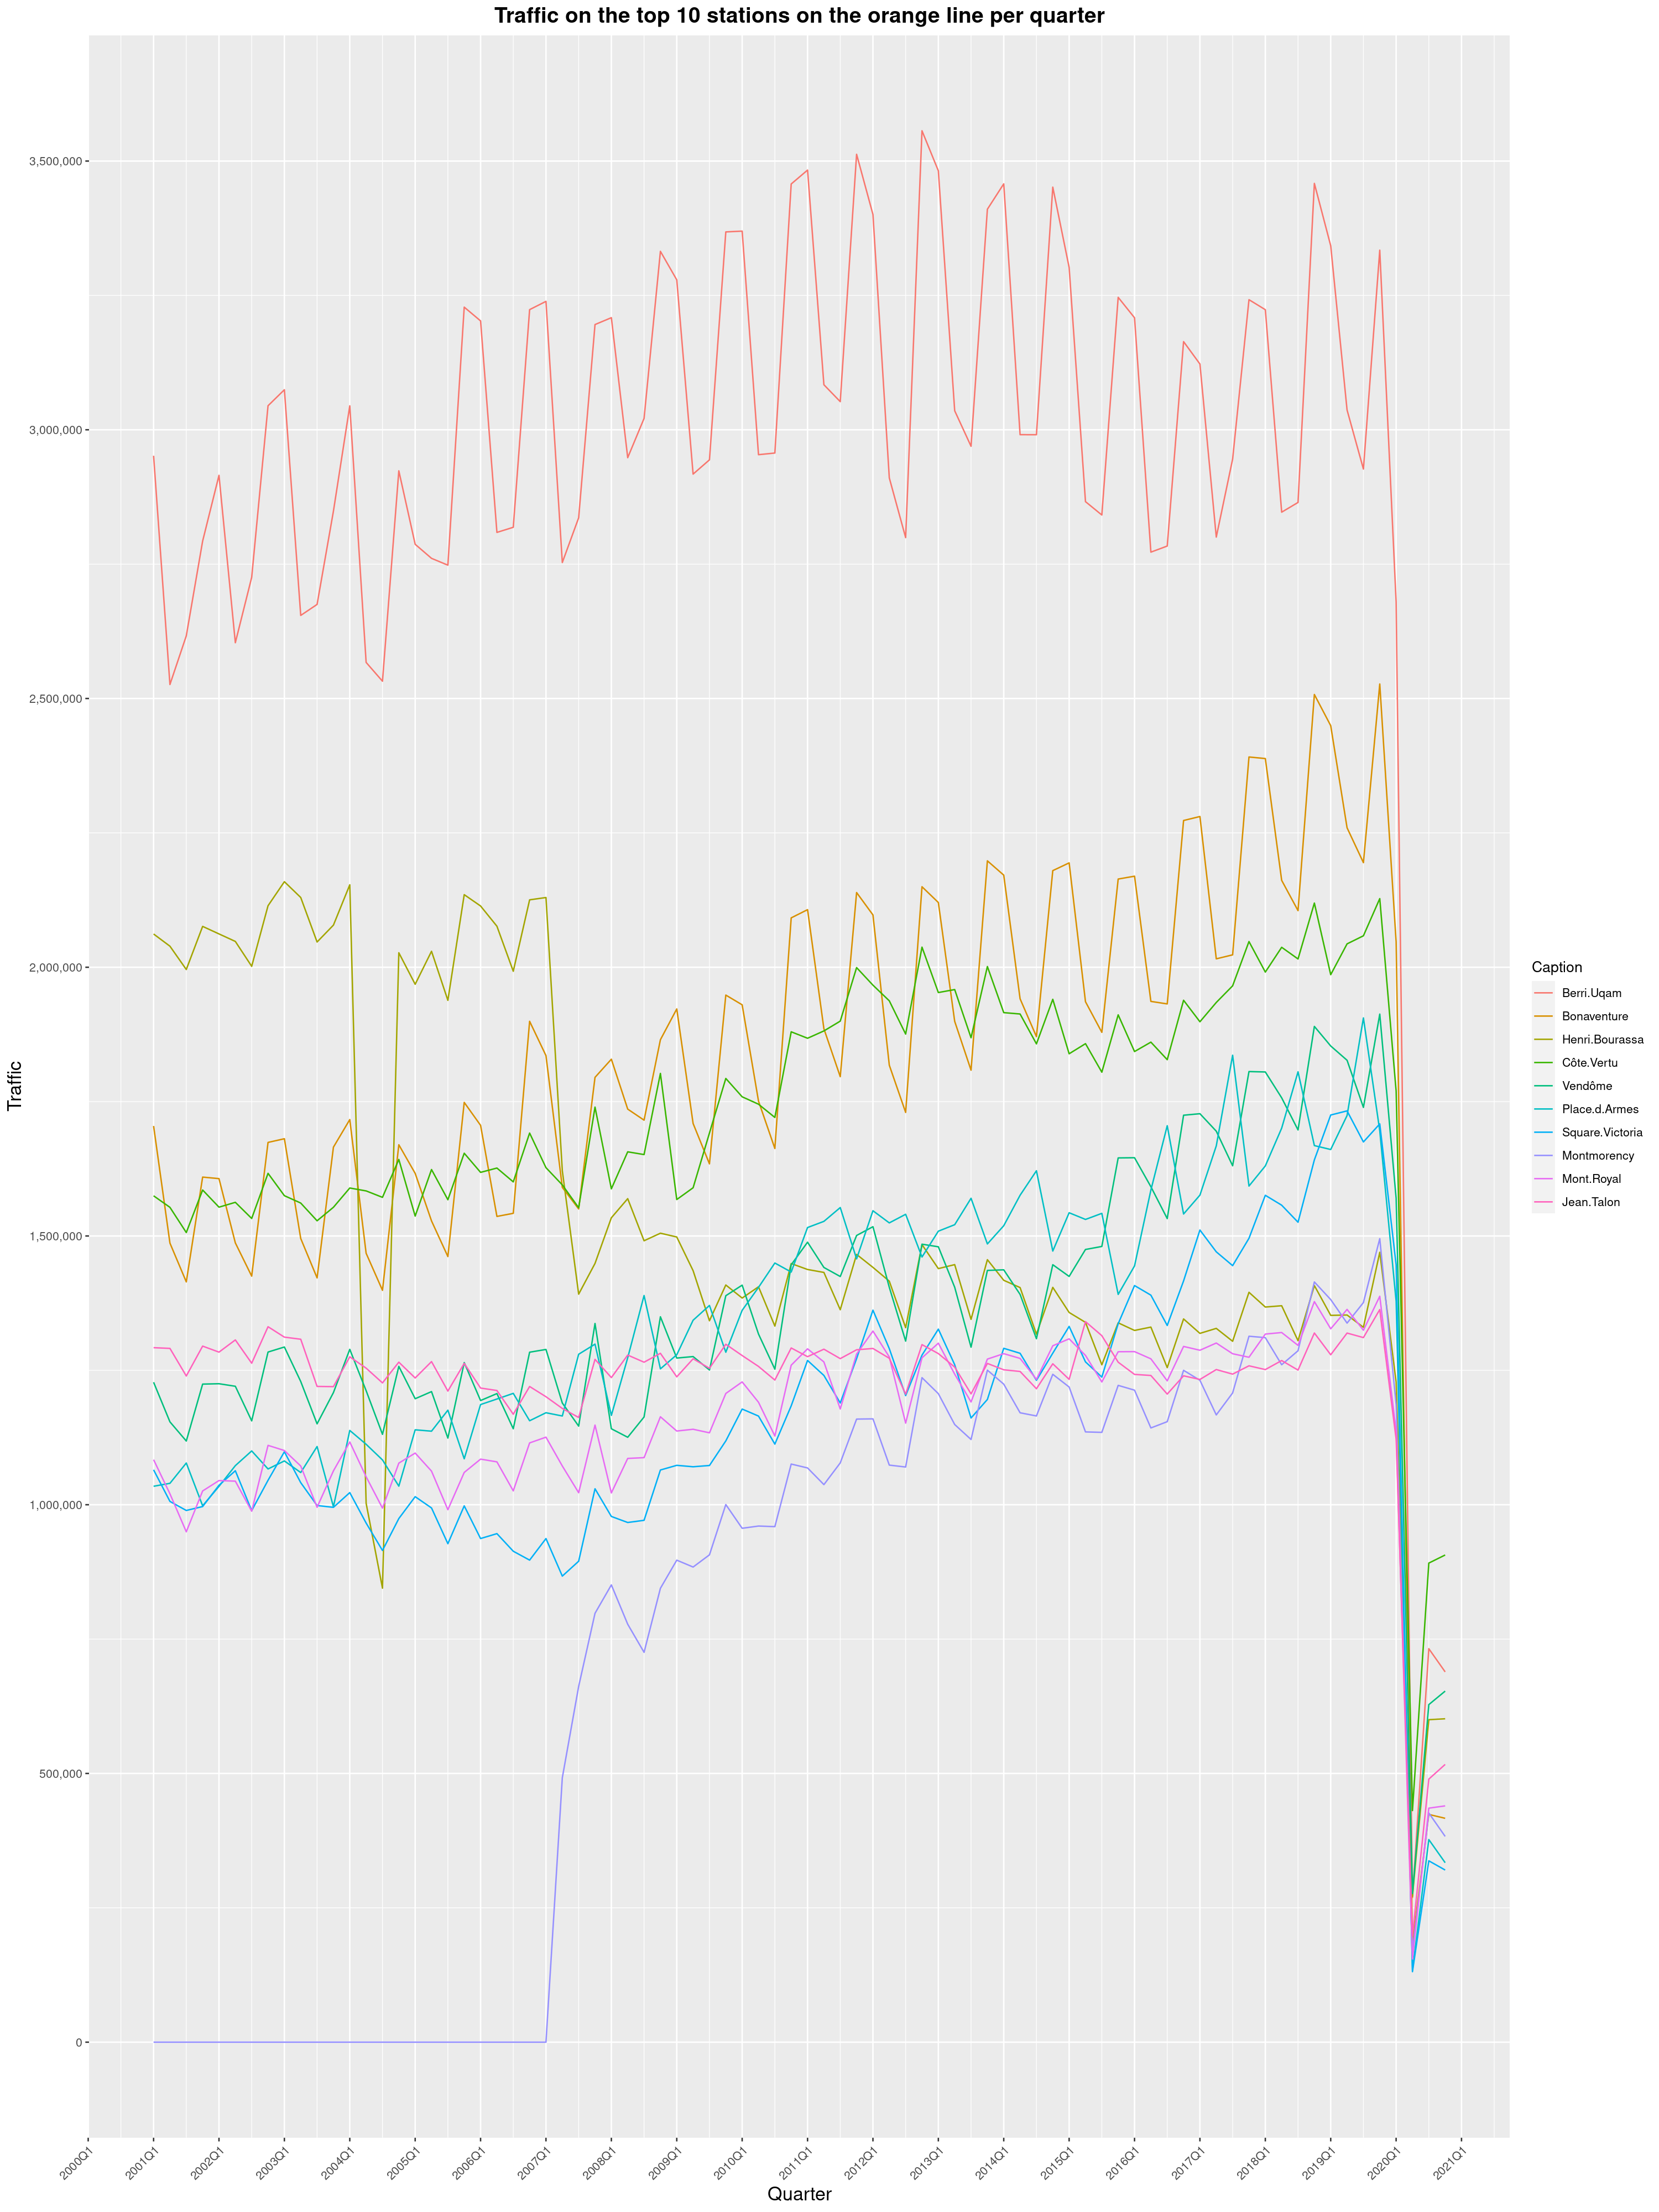
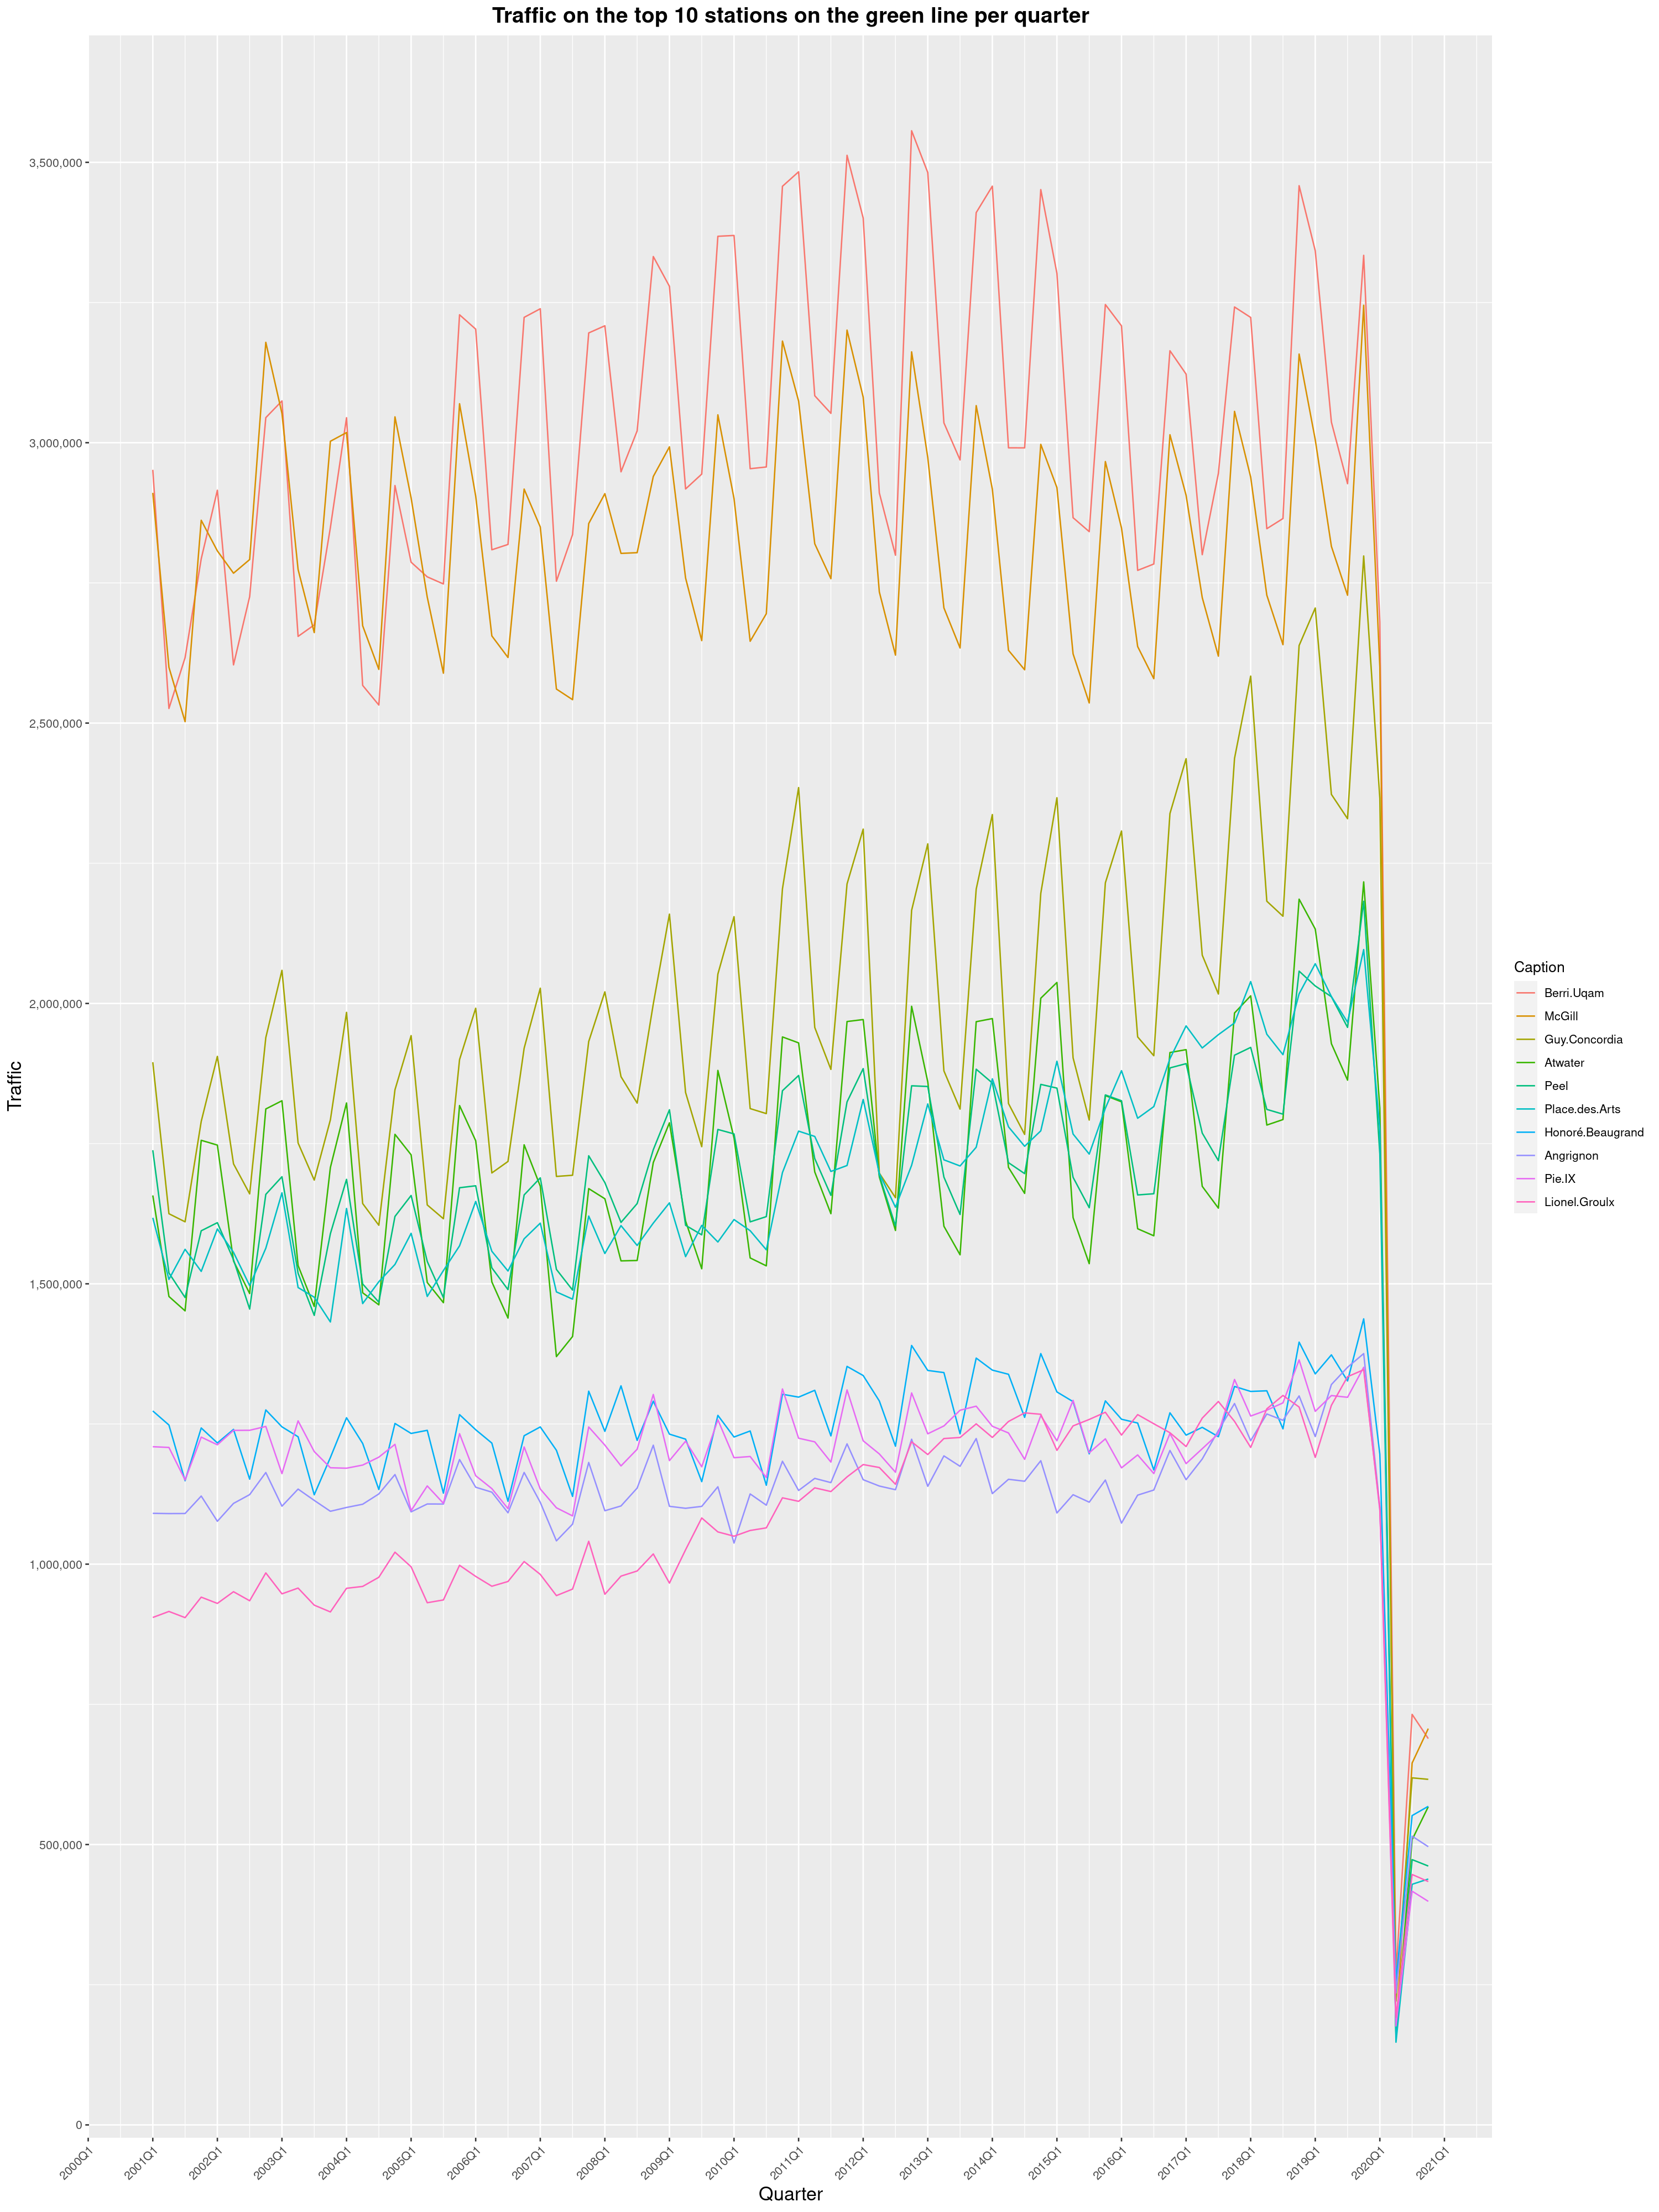
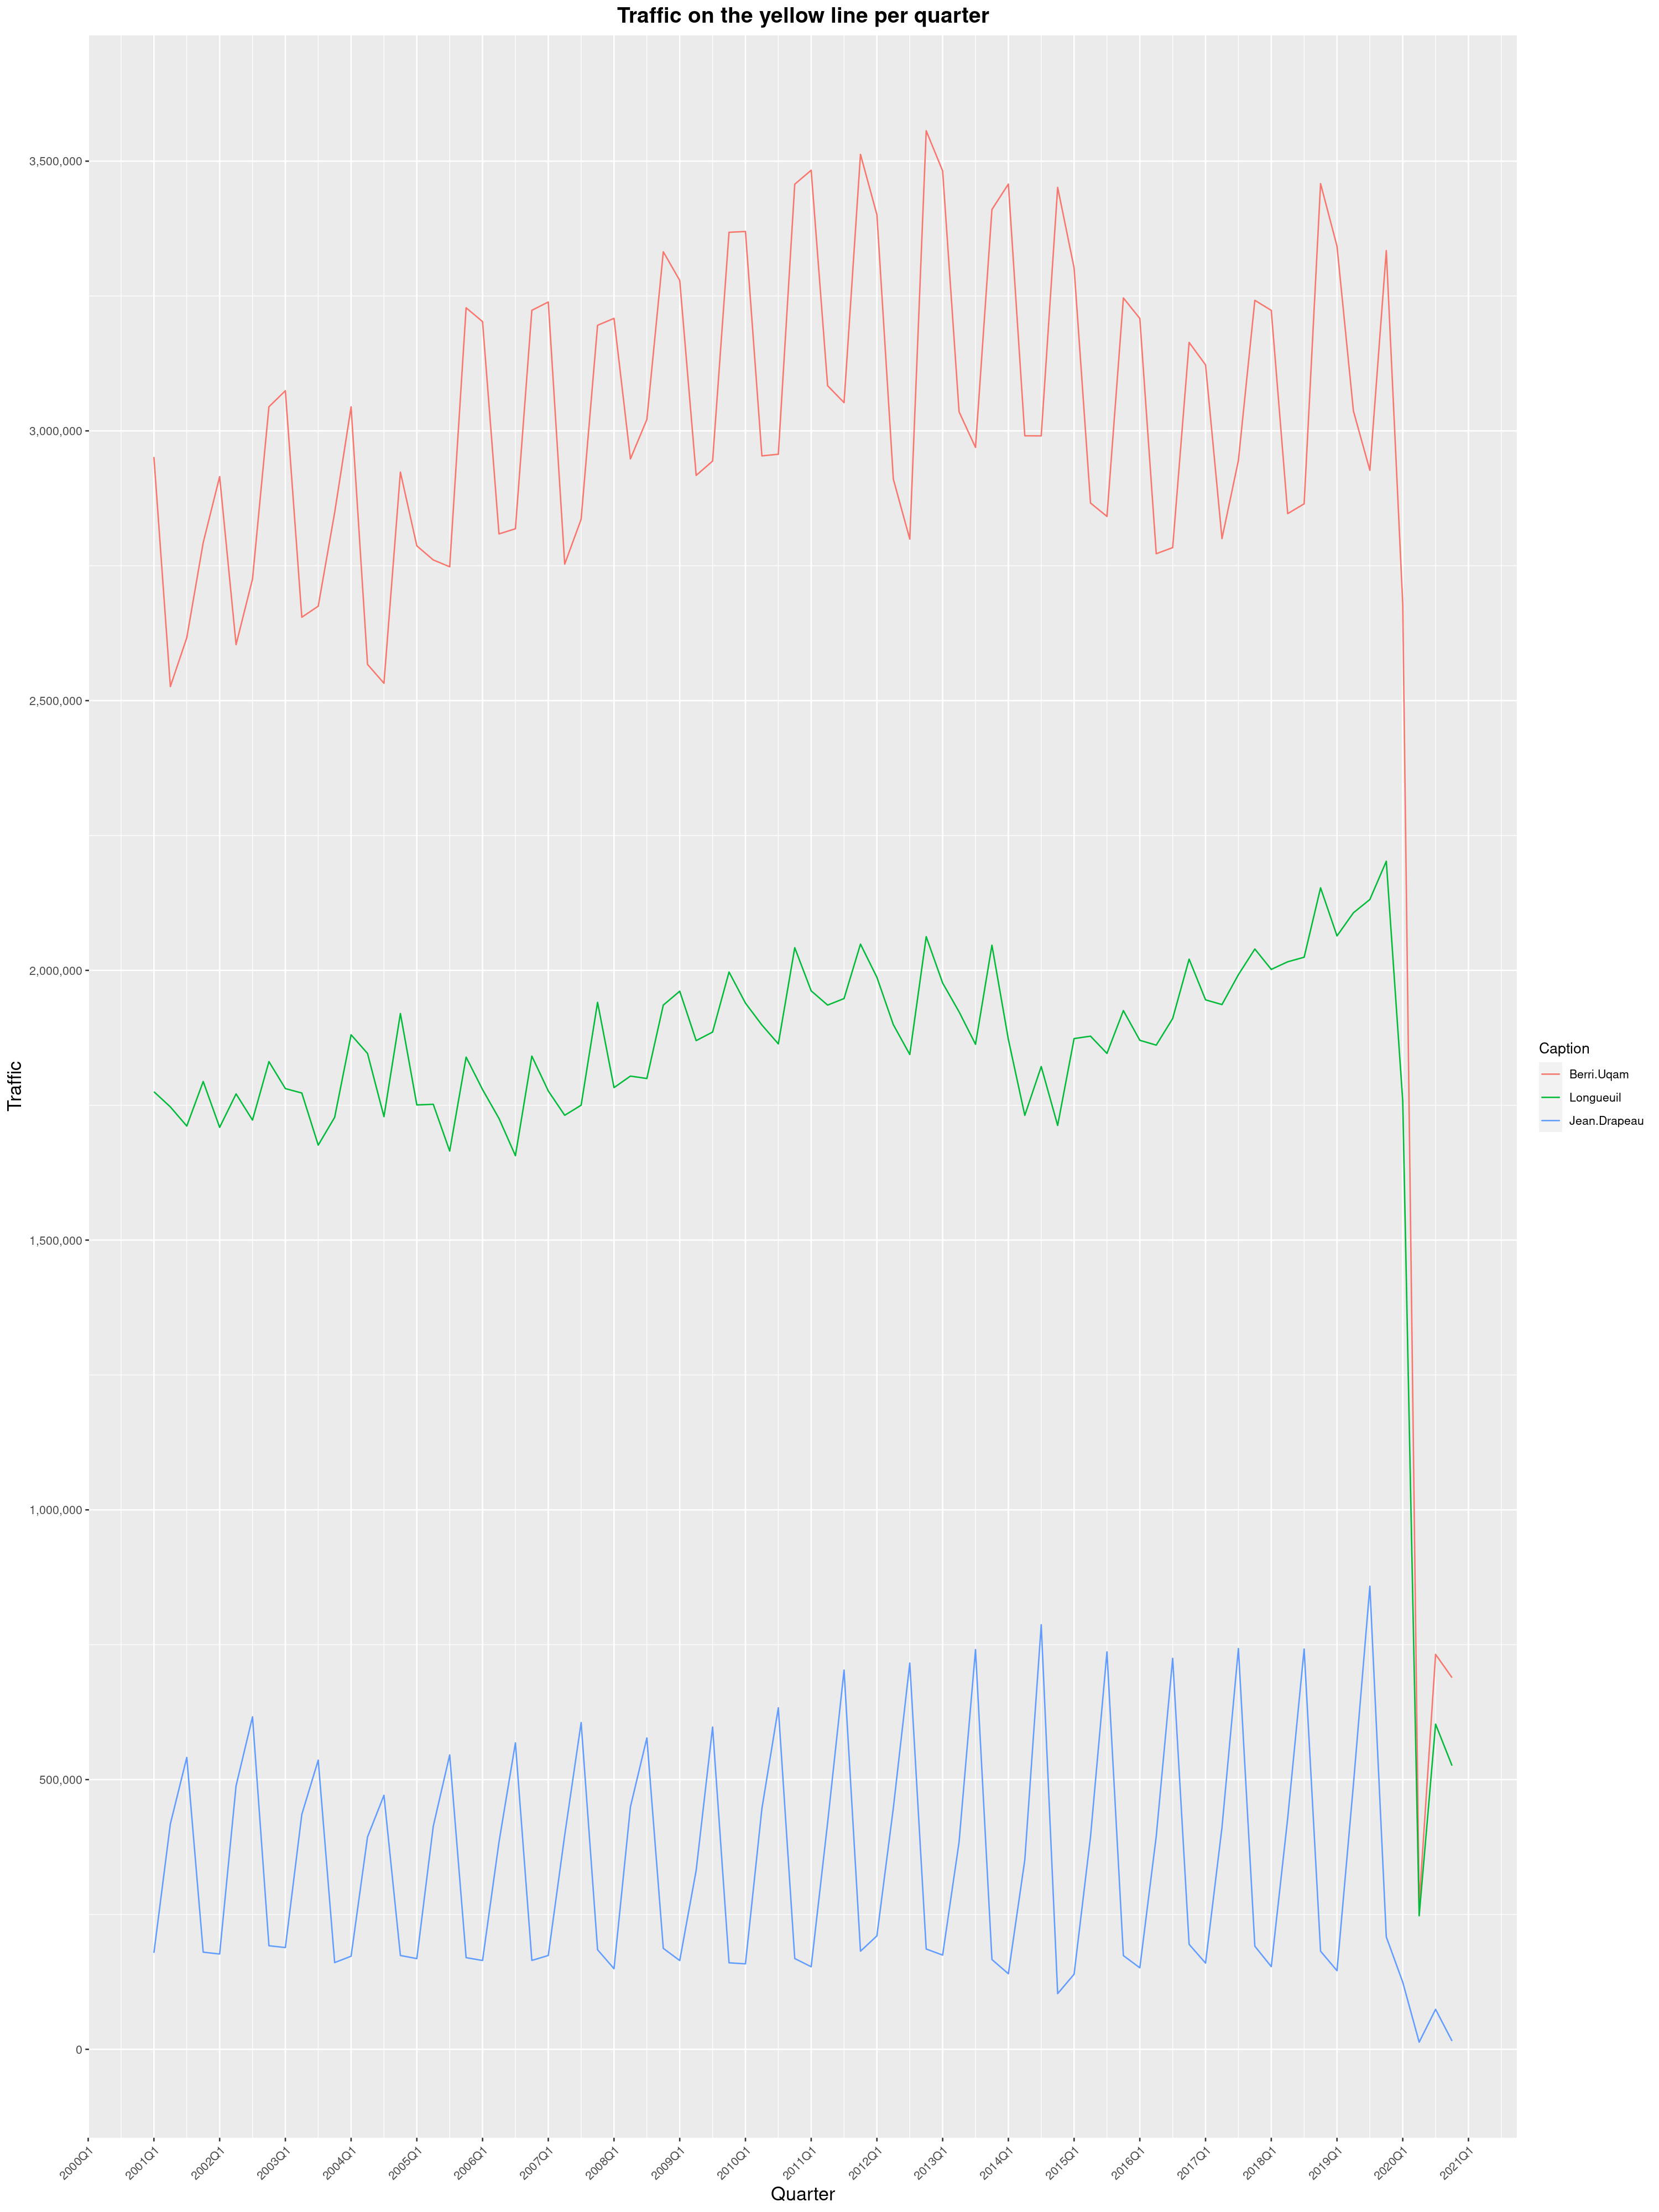
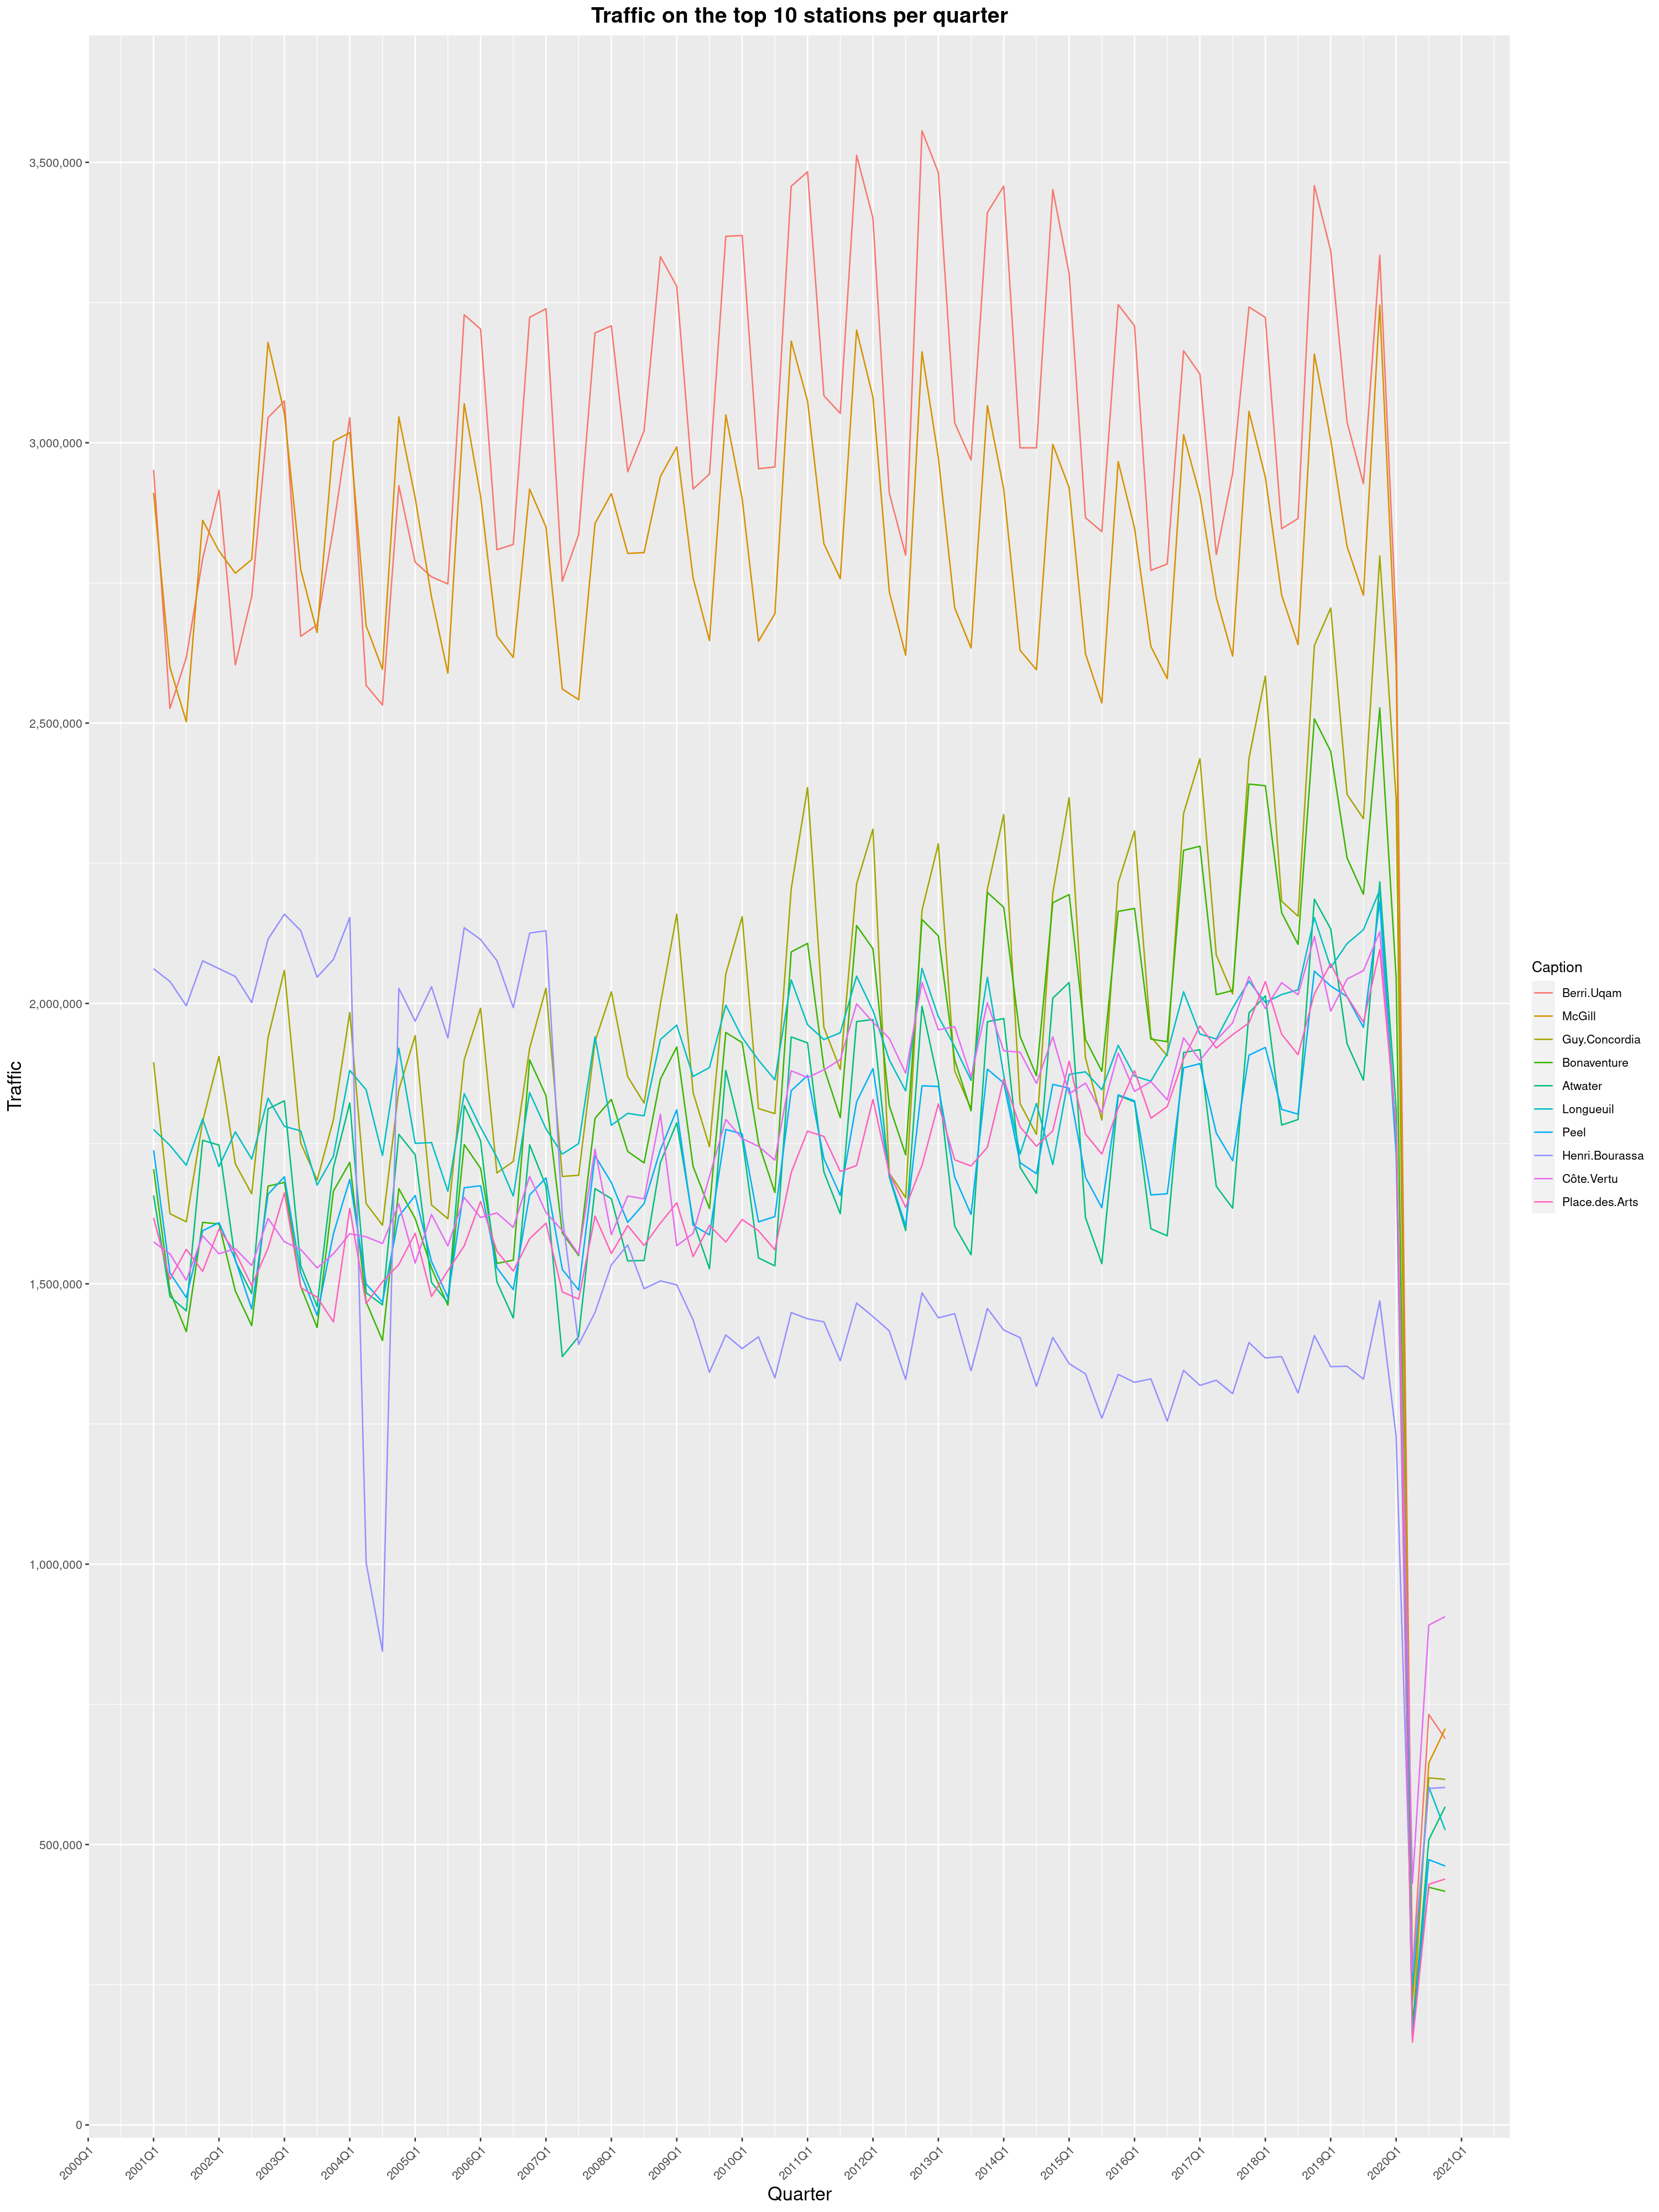
So here it is, data from 2001 to 2020, graphed the same way as in the original 2019 blog post. I could certainly juice this data, graph the pandemic using daily figures and come up with a long and interesting blog post analysing the main trends. I start teaching next Monday though and I still have prep work to do, so I'll leave that to someone else.
By clicking on a subway station, you'll be redirected to a graph of the station's foot traffic.

Licences
-
The subway map displayed on this page, the original dataset and my modified dataset are licenced under CCO 1.0: they are in the public domain.
-
The R code I wrote is licensed under the GPLv3+. Feel free to reuse it and write something nice about how the pandemic impacted the STM. I've made small changes to the 2019 version, but it's mostly the same thing.